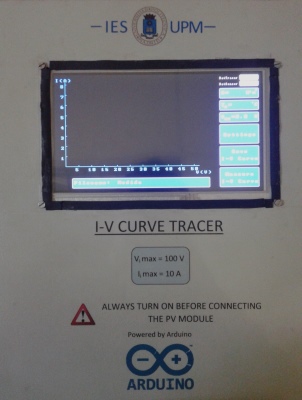
The I-V Curve Tracer
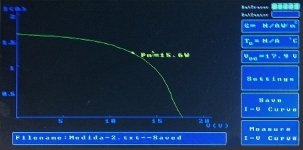
This device is the main element of the system as it is the one that actually perform the measurements in the desired panel, make the calculations required to extrapolate the curve to STC conditions and stores the data. But it's not limited to that. The tracer uses a capacitive load to measure the current and voltage of a desired PV module to plot its I-V curve.
Functional requirements
The same way it was done in the PV reference, the researchers had to establish the minimum functional requirements the device must comply. The proposed device must:
- Support a maximum voltage of 100V. This will limit the VOC of the PV modules that can be measured, and it's a critical factor when sizing the capacitive load.
- Support a maximum current of 10A. This will limit the ISC of the PV modules that can be measured and it's a critical factor when sizing the components of the power circuit, like, for example, the fuses.
- Measure the open-circuit voltage value of the desired PV module.
- Measure the short-circuit current value of the desired PV module.
- Be able to receive the incoming data of the PV reference sensor. As it was explained, the PV reference sends the data using radio signals. This is done using a wireless shield.
- Be able to make calculations of the extrapolation of the I-V curve.
- Be an autonomous device, with its own power source.
- Be able to store all the data measured, as well as the one calculated. This is done with and SD card storage device.
- Be able to log the time and date of the measurements. This is done with a Real Time Clock.
- Minimize the energy consumption, to increase the lifetime.
- Provide accurate, precise and repeatable measurement results.
- Be small in size.
- Be light in weight.
- Be low in cost.
- Be safe to use. In the PV reference the magnitudes used were really low so there is no risk, but in this case 100V and 10A can be dangerous. This will have an impact in the insulation on the components.
- Include the entire required elements in an enclosure that protects them from the environment and possible accidents.
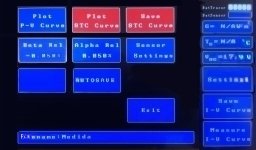
Although it was not initially a requirement, soon after the development started the researchers realized that the addition of a touch screen as a display and input device was really an important feature. As a result it was finally added to the device. This is important to understand some of the decisions made and its consequences because for example the addition of the display is a huge increase in the power consumption of the whole device.
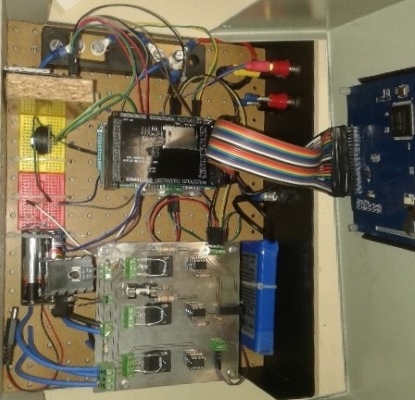
Hardware components
This section of the document aims to list and describe the elements used in the design of the I-V curve tracer. The components used are:
- A calibrated shunt resistor. Required to turn the short circuit current of the PV module into a voltage difference signal that can be measured on the Arduino ADC. In this case the relation of the shunt resistor was 10A = 60mV.
- An Arduino DUE board.
- A small PCB compatible with the Arduino board. This PCB is used to hold some of the signal circuits like the voltage divider of the PV module, the instrumental amplifier for the current of the PV module, an auxiliary voltage divider to measure the voltage of the capacitors, and PCB connectors required for wiring.
- Two small auxiliary customized protoboards for wiring the RTC to the SPI bus.
- An Arduino compatible Wireless shield. Used to receive the measurements from the PV reference sensor using radio signals under the Zigbee protocol. It includes an Xbee antenna.
- An adapter PCB for the TFT LCD touchscreen for the Arduino DUE board. The TFT LCD touchscreen, with an SD card slot.
- A lithium-ion battery, used as the main power supply for all of the electronics. It uses 12V and has a rated capacity of 4800 mAh. It is exactly the same model as the battery used in the PV reference sensor and the capacity test showed a similar value of 3200 mAh. It also includes its own charging device.
- An external SD card storage device.
- An accurate Real Time Clock model DS3231.
- A capacitive load, made out of two capacitors model SIKOREL EPCOS 100V 4700uF, in parallel configuration.
- A big power circuit PCB board which hold the three main power circuits and its signals circuits. This includes the discharge circuit, the negative pre-charge circuit, the measurement circuit, and all the logics used to activate them.
- Two external resistors of 47? each, used to dissipate the energy of the capacitive load under the discharge circuit with its proper heat dissipaters.
- A battery holder, to keep the two batteries used for the negative pre-charge fixed.
- An on-off switch, a push button, wires, connectors, banana plugs.
- Arduino DUE
After the good results and capabilities of the Arduino UNO in the PV reference sensor, the researchers decided to go one step further with the incorporation of a TFT LCD touchscreen on the requirements of the I-V curve tracer. One of the implications of introducing this element was the requirement of a more powerful board like the Arduino MEGA or the Arduino DUE. Finally the decision to use the Arduino DUE was that the ADC of this board has 12 bits of resolution, instead of the 10 bits the MEGA has.